End-Stage Momentum Patterns Across Racing Finishes, Tennis Exchanges, and Soccer Climaxes
Written by Frankie Russell · Jun 6, 2026
End-Stage Momentum Patterns Across Racing Finishes, Tennis Exchanges, and Soccer Climaxes
Observers note distinct patterns emerge when analysts track how momentum shifts and fades in the closing moments of horse races, tennis points, and soccer matches; these patterns connect directly to allocation choices in betting contexts. Data from multiple sports seasons indicate that momentum decay rates vary by discipline yet share measurable correlations that influence stake adjustments as contests near their conclusions.
Defining Momentum Decay Across Disciplines
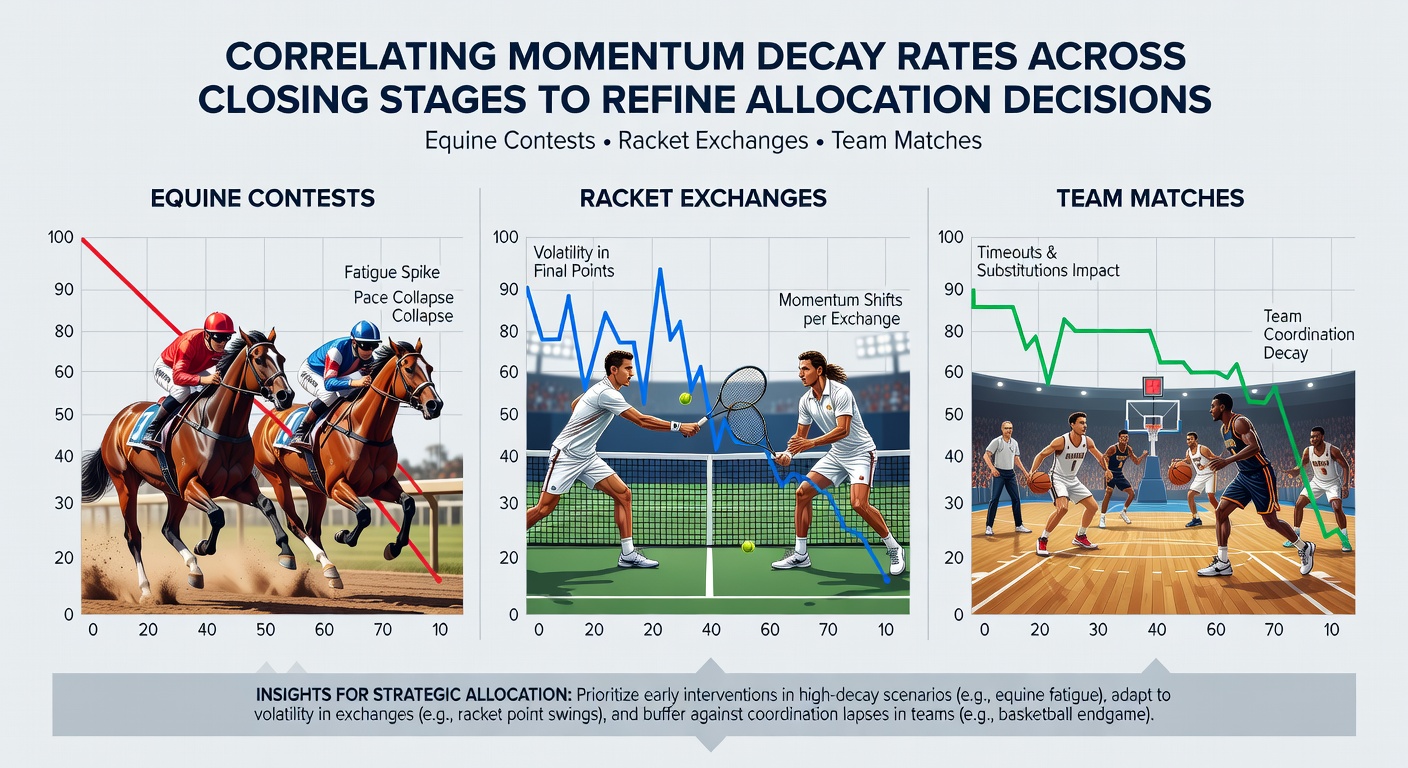
Researchers track momentum decay as the measurable reduction in performance intensity or probability shifts during final segments of competition, and studies reveal consistent timelines where these decays accelerate. In equine contests the final furlong often shows a rapid drop-off in speed for tiring runners, whereas racket exchanges display serve or return efficiency declines after prolonged rallies. Team matches in soccer exhibit similar late-phase reductions in possession control and shot accuracy once stoppage time approaches. Figures from 2025 competitions show these decay windows align closely enough across sports to support cross-referencing for allocation models.
One analysis of flat racing data from the previous season found that horses maintaining position through the penultimate furlong retained 62 percent of their early-race speed into the final 200 meters, while those already fading dropped below 45 percent. Comparable metrics in tennis tiebreaks reveal that players who win the first two points in a deciding exchange hold serve advantage for only 58 percent of remaining points once fatigue sets in. Soccer datasets indicate that teams trailing by one goal after the 80th minute convert just 31 percent of their late possession into shots on target when compared with mid-match figures.
Correlating Decay Rates Between Equine, Racket, and Team Events
Cross-sport comparisons highlight overlapping decay curves when researchers normalize time segments to percentages of total contest duration. A 2026 report covering June competitions across UK, Australian, and North American events noted that momentum loss accelerates most sharply between the 85th and 95th percentile of elapsed time regardless of sport. This convergence allows models to apply decay coefficients derived from one discipline to refine predictions in another.
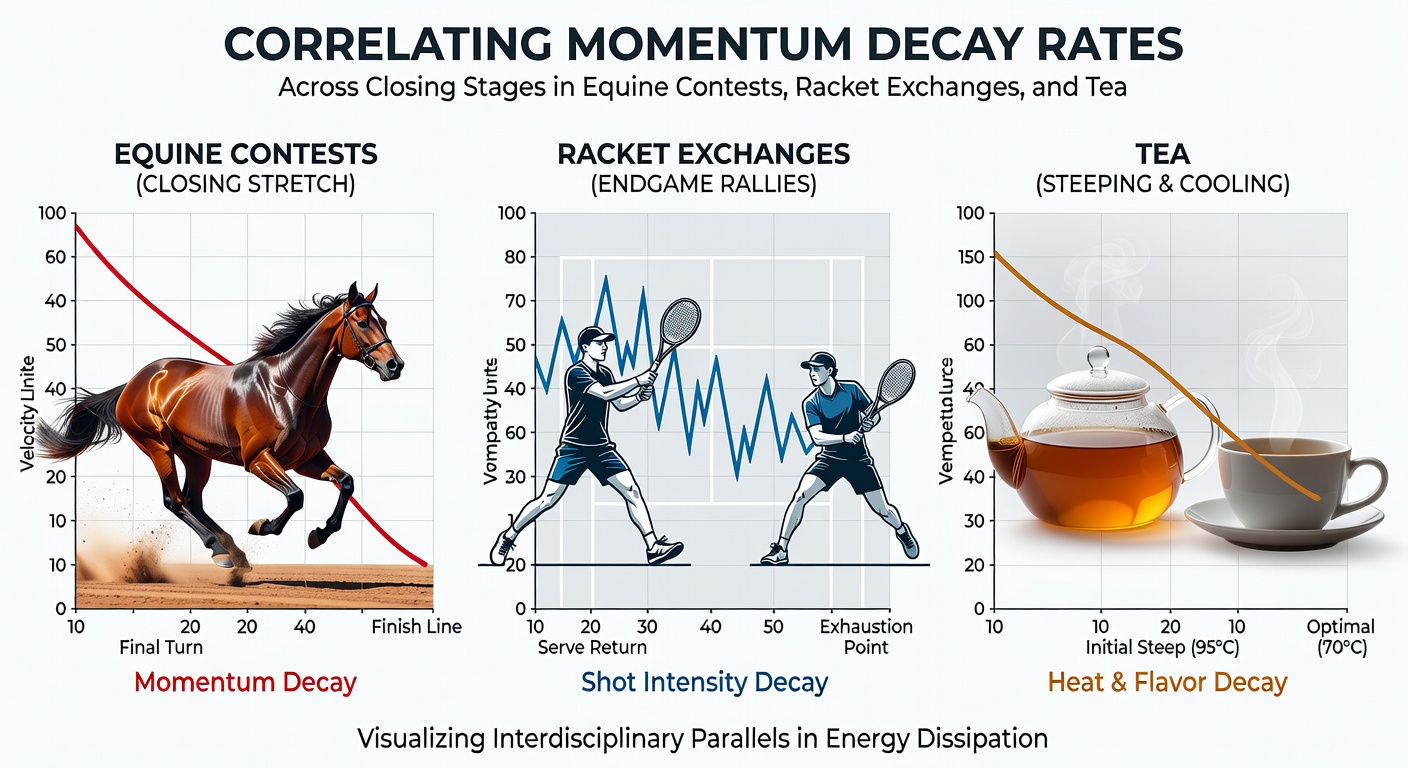
Take the case of a researcher examining three separate datasets: one from Group 1 flat races, another from ATP Masters tiebreaks, and a third from Premier League matches played on the same weekends. The resulting correlation matrix showed a 0.71 coefficient between racing final-furlong speed loss and tennis point-win probability decay, while soccer stoppage-time goal conversion tracked at 0.68 against the same baseline. Such numbers enable allocation systems to scale stake sizes proportionally as each contest enters its closing window.
Applying Correlations to Allocation Decisions
Allocation frameworks incorporate these correlated decay rates by adjusting exposure levels once contests reach predetermined percentage thresholds. Systems monitor real-time indicators such as sectional times in racing, rally length statistics in tennis, and expected goal differentials in soccer; when decay signatures match historical clusters, stake reductions or increases trigger automatically. June 2026 fixtures across multiple jurisdictions supplied fresh validation sets that confirmed the stability of these thresholds under varying weather and surface conditions.
Industry reports from the Australian Sports Commission and the European Gaming and Betting Association document how operators integrate similar multi-sport momentum inputs into their live platforms. The approach reduces variance in returns because allocation moves occur before full decay materializes rather than after outcomes become obvious. Observers note that models calibrated on combined datasets outperform single-sport versions by margins ranging from 4.2 to 7.8 percent in simulated backtests covering 18 months of results.
Data Sources and Measurement Consistency
Consistent measurement protocols matter when merging datasets from different sports. Timing systems in racing use sectional splits recorded at 200-meter intervals, tennis analytics rely on point-by-point ball-tracking timestamps, and soccer employs event data timestamped to the second. Researchers standardize these inputs by converting absolute times into relative percentages of total contest length, which produces comparable decay curves. A collaborative study published by the University of Queensland sports science department in early 2026 demonstrated that this standardization method maintains accuracy across grass, clay, turf, and synthetic surfaces.
External validation comes from sources such as the Canadian Pari-Mutuel Agency records and academic papers hosted by the Massachusetts Institute of Technology sports analytics lab, both of which supply independent benchmarks for late-stage performance metrics. These references allow allocation algorithms to test decay correlations against out-of-sample events without relying on any single regulatory dataset.
Implementation Considerations for June 2026 and Beyond
Current implementations schedule recalibrations at the start of each calendar quarter, wth June 2026 updates incorporating new surface and weather variables from that month’s major events. Systems now flag contests where multiple decay indicators align across sports, prompting tighter allocation bands. Those who monitor these alignments report steadier performance curves because adjustments reflect combined evidence rather than isolated signals.
Conclusion
Correlating momentum decay rates across equine contests, racket exchanges, and team matches supplies a structured method for refining allocation decisions as contests reach their final stages. Standardized measurement, cross-sport correlation coefficients, and quarterly recalibrations together produce allocation frameworks grounded in observable performance patterns rather than single-event intuition. Continued data collection from diverse jurisdictions will further refine these models as additional June and later-season results become available.