Integrating Segmental Performance Metrics with Live Market Trends for Optimized Stake Allocation in Multi-Sport Combinations
Written by Rosa Franke · Jun 2, 2026
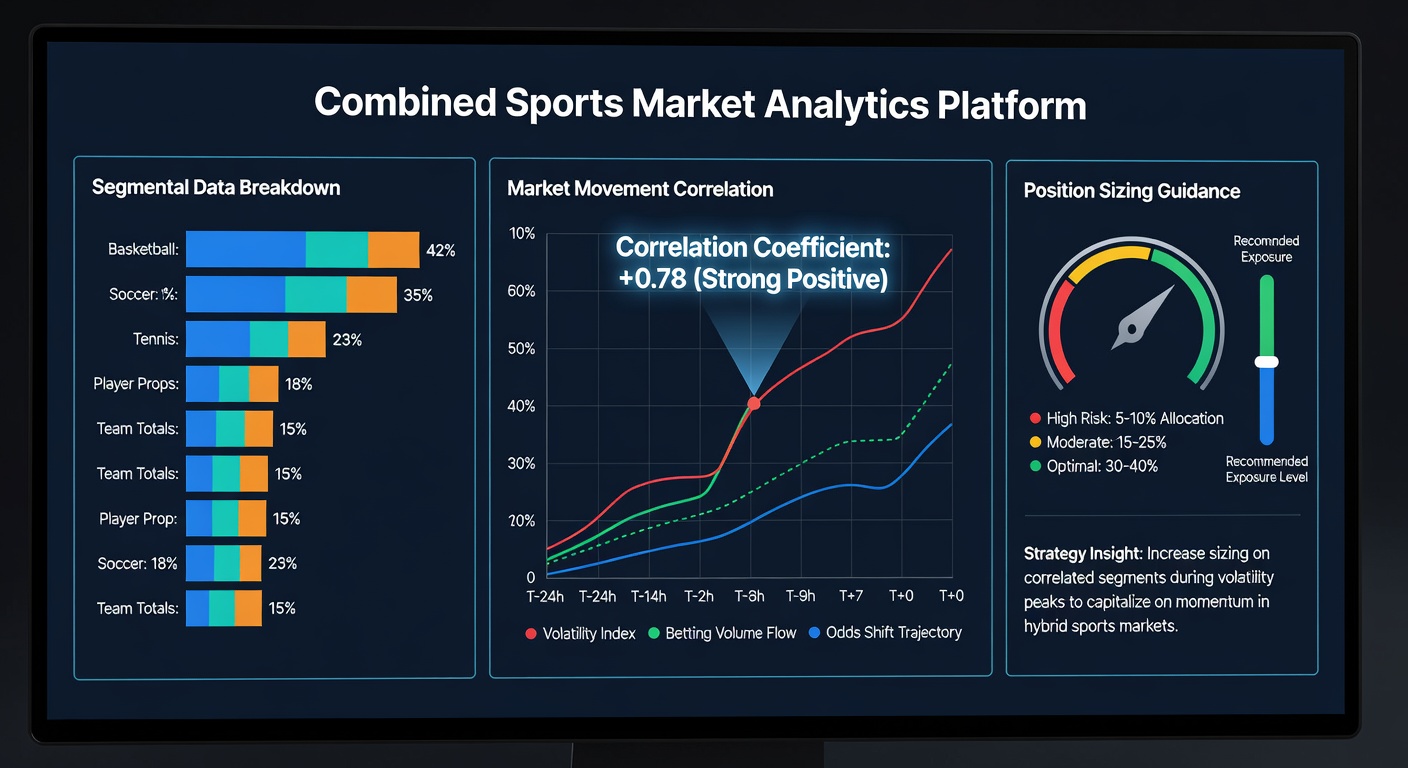
Integrating Segmental Performance Metrics with Live Market Trends for Optimized Stake Allocation in Multi-Sport Combinations
Analysts track performance segments such as individual race sections, soccer match halves, and tennis set intervals to identify how these discrete units align with shifts in betting odds, and this correlation process informs stake adjustments when operators combine wagers across multiple disciplines. Observers note that breaking events into measurable portions reveals patterns that single-event analysis often overlooks, particularly when live markets respond to incremental changes like a late surge in a flat race or a momentum swing after a tennis break point.
Defining Segmental Data in Multi-Sport Contexts
Segmental data consists of timed or scored intervals extracted from racing splits, goal sequences in soccer, and point clusters within tennis games, while combined markets merge these elements into accumulators or parlays that span several sports. Researchers have documented how each segment carries independent statistical weight, allowing models to isolate variables such as pace deceleration in the final furlong or serve hold percentages after the sixth game of a set. Data from industry reports shows that these granular inputs improve predictive accuracy when traders adjust exposure based on real-time odds movement rather than pre-match aggregates alone.
Market Movements and Their Segmental Triggers
Betting exchanges and bookmakers record rapid price adjustments whenever segmental indicators deviate from historical norms, and traders monitor volume spikes that coincide with these deviations to recalibrate position sizes. For instance, a sudden lengthening of odds on a favorite during a soccer second half often follows a measurable drop in expected goals derived from the opening period, prompting reduced stakes on remaining legs of a multi-sport ticket. Studies compiled by the European Gaming and Betting Association indicate that live markets incorporate segmental information within seconds, creating brief windows where informed sizing decisions can limit drawdown across correlated selections.
Position Sizing Frameworks Built on Correlations
Position sizing begins with mapping each segment's statistical contribution to the overall probability of a combined outcome, then scaling stakes proportionally to the strength of observed market alignment. Practitioners divide bankroll allocations into tiers that reflect both the segment's historical reliability and the magnitude of the current odds shift, using formulas that incorporate variance measures from past events. One documented approach weights the final segment more heavily in racing and tennis because late-stage data points tend to exert stronger influence on final results, whereas soccer models distribute emphasis more evenly across halves when tracking total goals in combined bets.

Software platforms now integrate these correlations into dashboards that flag when a segment's performance metric diverges from market expectations by more than a predetermined threshold, and users respond by trimming or increasing exposure on linked selections. Figures released by the Australian Gambling Research Centre highlight that operators employing such dynamic sizing tools recorded lower volatility in multi-leg portfolios during periods of elevated market activity. The method requires continuous recalibration because new data points arrive throughout each event, and analysts emphasize that static stake plans fail to capture the evolving relationship between segments and price action.
Practical Application Across Racing, Soccer, and Tennis
Consider a combined wager linking a horse's final sectional timing with a soccer team's second-half expected goals and a tennis player's tiebreak conversion rate, where each component updates independently yet influences the collective payout structure. When the racing segment shows an improving trend that outpaces market adjustment, operators increase the stake fraction allocated to that leg while holding the soccer and tennis portions steady until their respective segments generate comparable signals. Records from betting syndicates demonstrate that this segmented approach reduces the impact of isolated underperformance because capital exposure remains tethered to verified data rather than uniform percentages applied across all markets.
June 2026 brought expanded access to real-time sectional timing feeds from several major racing jurisdictions, and this development allowed more precise correlation models to enter mainstream use among professional bettors managing cross-sport portfolios. The additional data streams enabled finer distinctions between early pace and finishing speed, which in turn sharpened decisions on when to scale positions in accumulators that also included soccer and tennis components.
Conclusion
Correlating segmental data points with observable market movements supplies a structured method for determining position sizes in combined sports markets, and continued refinement of these techniques rests on access to granular, synchronized datasets across disciplines. Organizations that publish aggregated performance statistics continue to support the development of models that treat each segment as an independent variable within broader wagering strategies, thereby providing traders with measurable inputs for ongoing stake calibration.